如何追踪追踪程序
如何追踪追踪程序
概述: 就是如何去追踪自己写的ebpf程序的性能。举个例子,你写了一个ebpf程序,想要将其附加到内核函数后,看看内核函数的延迟变大了多少。
说明:
本文章以测试tcp_v4_send_reset()函数延迟为例子,我们可以知道tcp_send_reset()本身是作为一个tracepoint的,而且tcp_v4_send_reset()会调用它。所以我们将epbf程序通过tracepoint附加到tcp_send_reset(),通过kprobe/fentry附加到tcp_v4_send_reset(),只需要通过测试tcp_v4_send_reset()延迟即可比较二者性能差异
相关仓库: - 测试负载代码仓库: https://github.com/1037827920/test-for-rstreason - ebpf程序代码仓库: https://github.com/1037827920/libbpf-template
工具介绍: - perf-prof,这是一个基于perf的工具,可以通过perf probe来附加探针后进行统计内核函数运行时间。直接下载源码编译即可。 - perf,用于系统性能调优,瓶颈定位和应用程序行为分析。利用硬件性能计数器(PMU)、软件事件、tracpoints、kprobes和uprobes等机制,提供对内核和用户空间的深入观察能力
无探针情况
概述: 首先我们要先测试在没有任何ebpf程序附加的情况下,内核函数的运行时间,以此来作为baseline。
测试步骤: 1. 增加probe点: 1
2perf probe --add tcp_v4_send_reset
perf probe --add "tcp_v4_send_reset%return"1
perf-prof multi-trace -e "probe:tcp_v4_send_reset" -e "probe:tcp_v4_send_reset__return"1
2# 执行仓库test-for-rstreason下的脚本
bash test-skb-performance.sh
测试结果: 
针对tracepoint类型
概述: 在将ebpf程序附加到tracepoint上,测试内核函数的延迟
测试步骤: 1.
将ebpf程序附加到tcp_send_reset()tracepoint: 1
2# 执行仓库libbpf-template examples/tracepoint/tcp_send_reset下的程序
./main1
perf-prof multi-trace -e "probe:tcp_v4_send_reset" -e "probe:tcp_v4_send_reset__return"1
2# 执行仓库test-for-rstreason下的脚本
bash test-skb-performance.sh
测试结果: 
针对kprobe类型
概述: 在将ebpf程序附加到tracepoint上,测试内核函数的延迟。因为perf probe机制其实就是通过给函数的入口和出口以kprobe的方式附加ebpf程序进行延迟计算,而内核是无法确定你注册的两个ebpf程序的执行顺序,所以在针对附加了kprobe类型ebpf程序的内核函数延迟计算,我想到的方法就是直接在要附加的ebpf程序的入口和出口都进行时间戳的记录然后计算delta值
测试步骤: 1.
将ebpf程序附加到tcp_v4_send_reset()kprobe: 1
2# 执行仓库libbpf-template examples/kprobe/tcp_v4_send_reset下的程序
./main1
perf-prof multi-trace -e "probe:tcp_v4_send_reset" -e "probe:tcp_v4_send_reset__return"1
2# 执行仓库test-for-rstreason下的脚本
bash collect-delta.sh1
2# 执行仓库test-for-rstreason下的脚本
bash test-skb-performance.sh
测试结果: 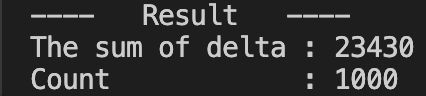
结果
| 类型 | 无probe | tracepoint | kprobe |
|---|---|---|---|
| 时间(ns) | 8.299 | 13.894 | 23.430 |
可以看到kprobe的性能是要比tracepoint的差的
fentry和kprobe谁先执行?
概述: 在一开始的时候,作者想直接通过fentry的方式来计算带有kprobe类型ebpf程序的内核函数延迟,即通过funclatency(这是bcc中的一个工具)。但是想要这样测试,必须先验证一下二者的执行顺序,作者一开始没有做实验被坑惨了
方法: 通过bpftrace快速编写ebpf程序进行测试
测试步骤:
- 附加一个kprobe类型的ebpf程序:
1 | |
- 附加一个fentry类型的ebpf程序:
1 | |
- 执行测试程序:
1 | |
- 观察:
1 | |
结果: 
可以看到是先执行kprobe类型的ebpf程序的,即使把kprobe和fentry的附加顺序换一下还是一样的结果